
 With our dam now full, one task that’s been on our list since summer is to calculate its approximate capacity to aid with planning our watering infrastructure. We found a couple of possible methods: the Western Australian Department of Agriculture has a very thorough approach, while the Victorian Department of Primary Industries offers a rougher option. We opted for the Victorian method, not least because it offered a chance for us to take our very patriotic inflatable adventure craft out onto the pond.
We needed a couple of figures to calculate the dam’s capacity – the surface area of the dam and the maximum depth. The surface area we calculated with the aid of Google Maps, measuring two radii for our roughly elliptical dam (the surface area for an ellipse is pi x radius for the long part of the ellipse x radius for the narrower part of the ellipse).
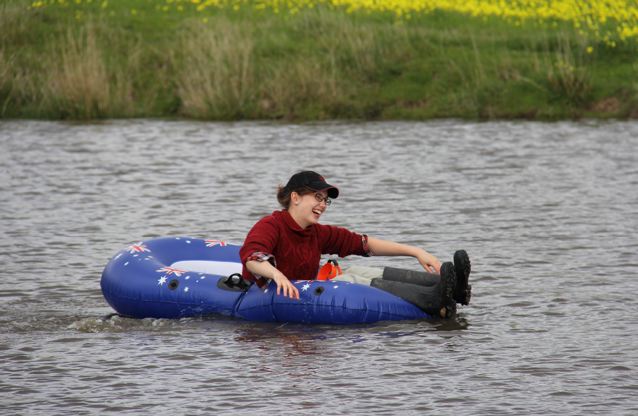
Sophie gallantly volunteered to take the boat out and plumb the depths with a fishing line and sinker. Luckily for her, the first hints of spring are emerging: the air was alive with the songs of bees and birds, and the ratio of sunshine to apocalyptic downpours is gradually shifting towards the warm-and-dry end of the spectrum.

Big dam, small boat
Looked on by a pair of bemused Grebes, and with a support crew of Nat, Jess and Oliver, Sophie whipped around the dam, took several measurements to find the most likely depth and reluctantly came ashore before hypothermia set in.
With surface area x maximum depth x 0.4 (to account for the slope on the sides of the dam), we’ve calculated a rough capacity of about 1.1775 megalitres (or 1,177,500L).
The joy of maths

So cute and brave! next time you should wear flippers.